


We got a great response from Dave Miller's Op-Ed Op-Ed; What Draft Data Says About Elite College Player Development and Dave gave us an equally compelling follow-up. Here it is:
As this summer's international test window unfolds, USA rugby fans are again reminded of the need to develop a wider pool of domestic players, with higher levels of skills, through far greater match exposure to top competition.
This month's 'MLR Rising’ pre-draft event appears part of that equation. As American rugby's pathway begins to emerge, the productive integration of MLR and college rugby becomes critical to the success of USA's "Moonshot" towards 2031.
But in the world of US collegiate rugby, the choice of where to compete appears increasingly determinant of player trajectories, and their future professional and international opportunities.
Why does this matter? Rugby is a sport that hinges on experience,– where decision-making, tactical acumen, and physical resilience are honed under pressure. To compete effectively at the highest levels, American athletes must be accustomed to the demands of regular, sustained and intense rugby. Truly unique to America is the tradition of intercollegiate athletics. So college rugby should provide that environment.
Yet for too long America's collegiate structure has been divided by parochial suspicions, amplified grievances, tiring grudges, geographical divides and seasonality. That has left college rugby divided between an independent corporation, National Collegiate Rugby (NCR) which claims Fall for the national championship, and World Rugby-affiliated Collegiate Rugby Association of America (CRAA), with rugby's traditional spring postseason.
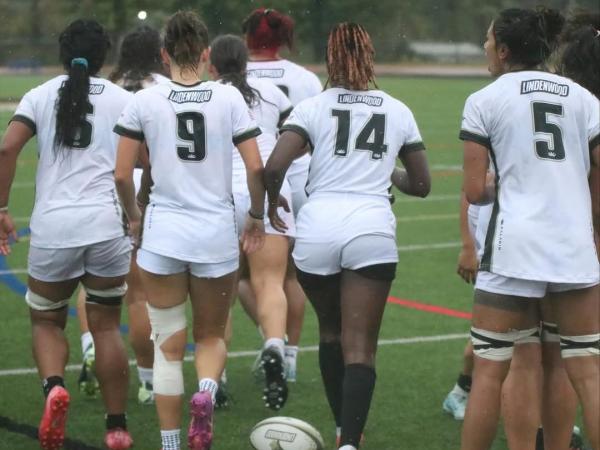
Once the domain of a few powerhouse programs (notably Cal, BYU), CRAA's most recent D1A season again proved the widening parity of committed club and varsity sides, including Central Washington, Saint Mary's, Navy, Army, Life, and Lindenwood, among others. For ambitious athletes (and coaches) aiming to maximize their potential, the value of playing in such a competition, and in an extended playing window, is increasingly clear.
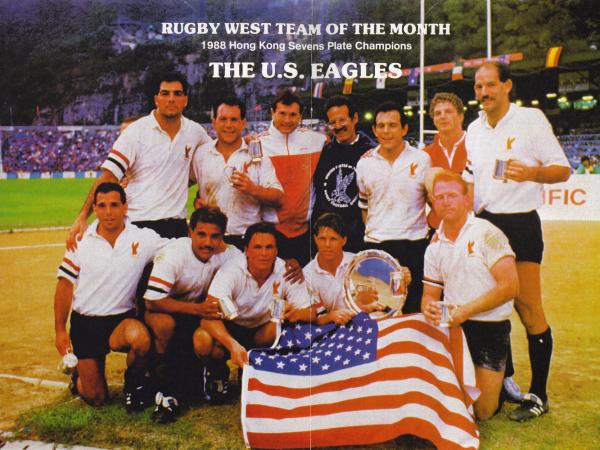
Setting aside the marketing indulgences, the actual amount and standards of college match play is material to how college rugby players, future USA Eagles (and MLR) will turn out. If you're interested in the Eagles and MLR, you have a stake in the shape of college rugby. A recent statistic from Major League Rugby showed that 78% of 2024's MLR Rising players were from CRAA-member programs, with 32 top players representing 18 different CRAA institutions. (Reciprocally, NCR has only 22% of Rising players, despite allegations to represent the majority of college rugby players.)
A primary assessment of the competitive environments between NCR and CRAA demonstrates how very much more rugby players are receiving in D1A's standards, structure and extended playing window.
A Look at the Numbers
For the sake of objectivity: Let's take Goff Rugby Report's year-end rankings, identifying the Top 15 teams in NCR D1 and those at the top of CRAA's D1A. (I'm not ignoring the extremely good rugby that's being played in pockets of D1AA. (Shout-out USD Toreros!) This is simply for comparative purposes.)
Then, let's look at the 2023-2024 academic year, to see how much rugby was played, according to each program's posted schedules/social channel. From here, we can determine "Match Days" for each program. For the sake of preparing players for MLR and the Eagles in 2031, this tally includes:
- Days with a 15s match only
- Collegiate of senior club matches only, not alumni scrimmages
- Multiple shortened matches on the same day (Storer Classic, etc.), count as just one match day
- 1st- and 2nd-side matches on the same day represent just one match day
The Top 15 D1A programs played over 90 (64%) more 15s matches than the top of NCR in the past annual cycle. That's an astonishing number.
Players in CRAA D1A average 15.67 match days per year, compared to just 9.53 for NCR players in their shortened Fall trophy-giving season.
This yawning disparity of 64% more rugby annually is more than just a number; it represents a critical difference in the depth and quality of competitive experience available to college players.
Long-Term Effects
Over the 4-year career of a college player, that's about 24 college rugby 15s matches an NCR player is not playing. The USA Eagles and aspiring MLR players simply cannot punt on 24 high-level college matches. That's simply not enough rugby to be an actual high performance rugby player. While it may be credibly long enough to award some kind of participant trophy, the myopic drive to contain college rugby to Fall presents an insufficient cycle for US player development and meaningful competition.
That's not conjecture or mere preferential opinion: Ireland tells us that. Top 14 tells us that. MLR data is telling us that. The USA's international results are telling us that.
For players and coaches to compete authentically towards a 'Collegiate National Championship' requires everyone in college rugby getting on the same page, for the sake of players, for an upcoming spring.