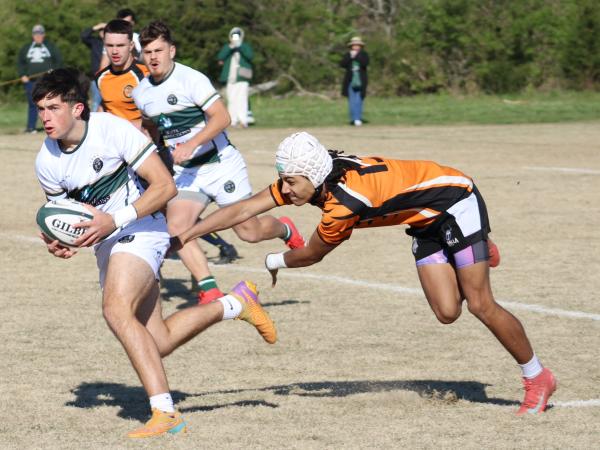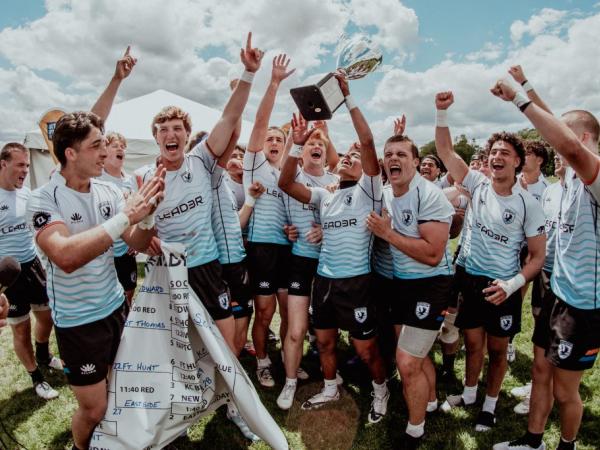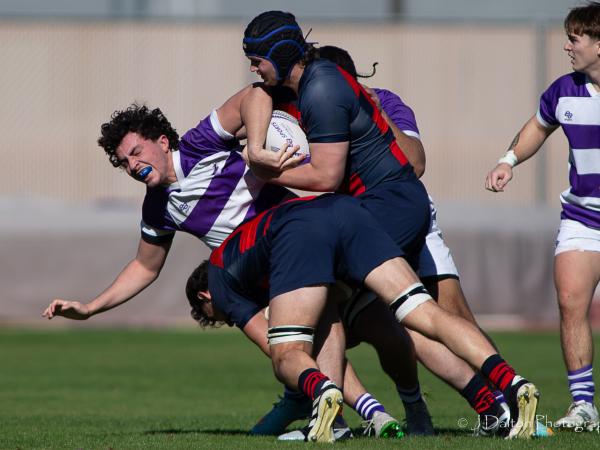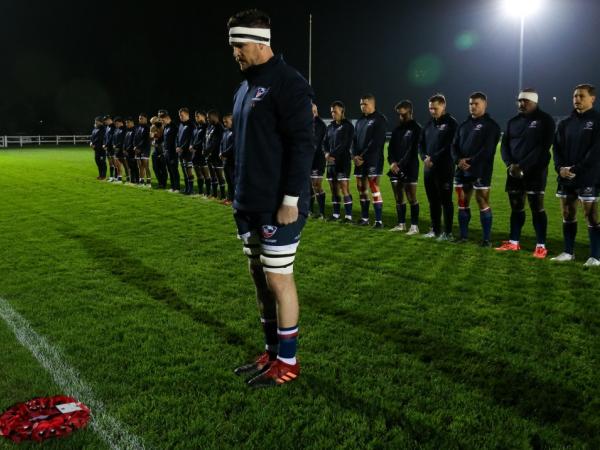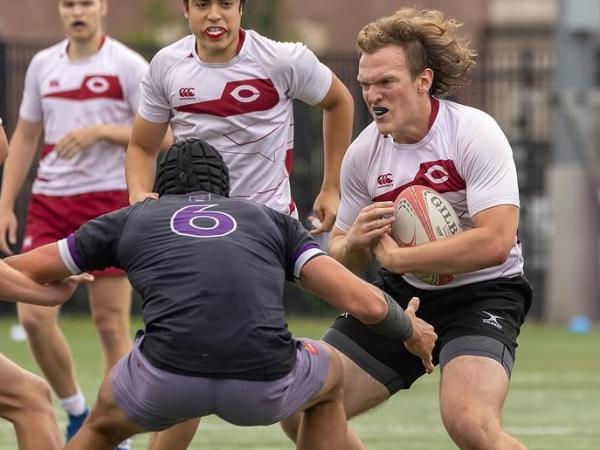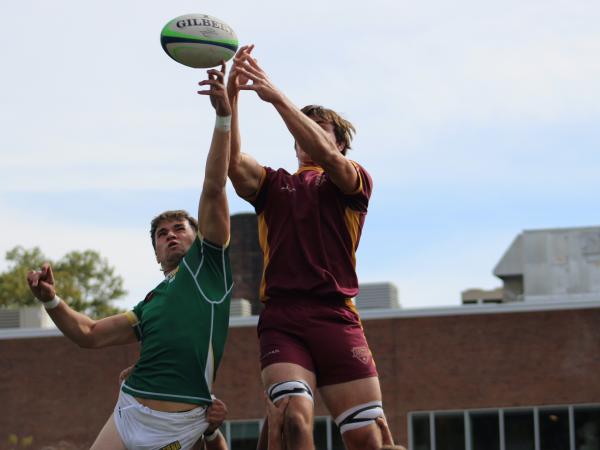


We unveiled these Power Ratings powered by Silverbacks Elite Rugby lst week and they're back for this week, Week 4 of competition.
SIlverbacks Elite Rugby offers year-round programming and skill development for players and coaches in the Upper Midwest who want to be great. The program provides a high-level training environment with personalized plans for every participant. For more go to silverbacksnation.com.
Now, this is an objective, data-driven rating, unlike Goff Rugby Report's own weekly subjective rankings (go here to see all our rankings). How does it all come together? Here's a little FAQ:
How does the Power Index work?
Precedent for the Index: The World Rugby ranking system was the starting point in developing the Power Index.
Closed System: There are a finite amount of Rating Points. When you beat a team (or draw with a higher rated team), you take some of their points.
Big Wins > Small Wins: A big win is by a 15+ point margin. Big wins earn teams double the Rating Points vs small wins.
Strength of Schedule Matters: The Index calculates a Rating Point difference for each game. If Team A has a difference of -15 Rating Points, a big win earns them 7.2 Rating Points. If the difference is 0, a big winner earns 3.6 Rating Points.
Beating Overmatched Opponents: If Team A has a difference of 15+ Rating Points, a win of any magnitude earns them 0 Rating Points.
Home/Away is Considered: The home team receives a +3 Rating Point boost in the difference calculation for each match.
Why are current & former D1A teams most prevalent in rankings?
Historical Data: The Power Index program was able to pull D1A data from USA Rugby’s old CMS. Because of our large sample size, we are reasonably confident about where these teams stand.
D2: We have seen comments asking about whether D2 teams are being tracked. We have been tracking results since the start of the Fall season. With 40 or so D2 matches being played each of the next few weeks, we expect to have an accurate picture of that division soon!
Who’s not in the Top 40 yet? This week, we felt we had enough data to bring four D1AA/NCR1/NCR2 teams into the Top 40: Bowling Green, Adrian College, Mary Washington, & Kentucky. There are six more similar teams that may be worthy of the Top 40 but we still do not have enough data to feel confident ranking them: Dartmouth, Iowa Central, Mount St. Mary’s, Queens, St. Joseph’s, and Tennessee (we list their data below).
Who is producing the Power Index?
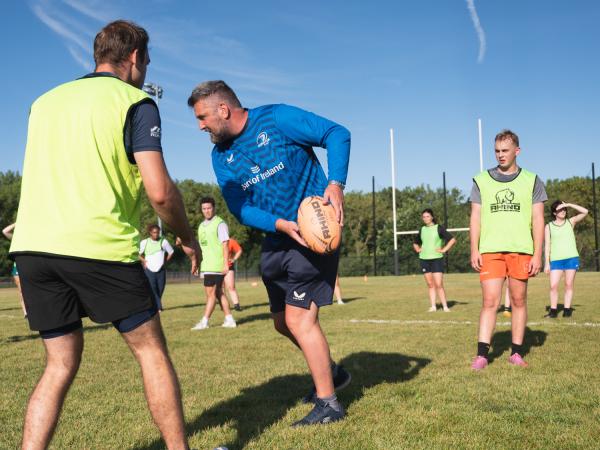
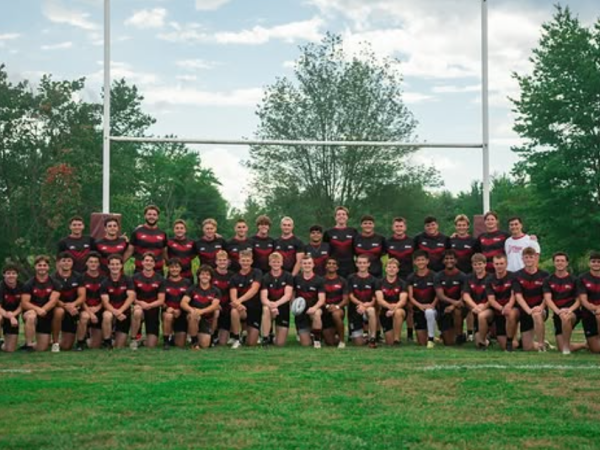
Silverbacks Elite Rugby is a new High-Performance organization based in the Midwest. Their goal is that an athlete’s club/school team + Silverbacks will provide a training environment and resources comparable to what same age-grade athletes have access to in Tier 1 Rugby nations.
To fulfill its mission and vision, Silverbacks is putting on a number of clinics this Fall in Chicago, Effingham (IL), Fond du Lac (WI), Waterloo (IA), and Yorkville (IL). If you want to learn more about their upcoming clinics, check out their Events Page.
Silverbacks created their own analytics program to serve their mission. They used D1A data to test the program’s capabilities. From this test, the foundation for the Power Index and collaboration with Goff Rugby Report was born.
 | |||||||||
| Rank | Change | Prev | School | Comp | Group | Week 4 | PREV RAT | CURR RAT | Δ RAT |
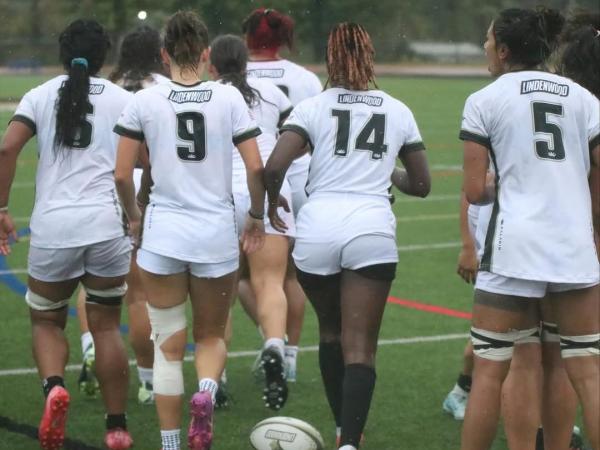
| 1 | 0 | 1 | Lindenwood | D1A | ELITE | 97.64 | 97.64 | 0 | |
| 2 | 0 | 2 | California | D1A | ELITE | 97.29 | 97.29 | 0 | |
| 3 | 0 | 3 | Life | D1A | ELITE | 96.94 | 96.94 | 0 | |
| 4 | 0 | 4 | St. Mary's | D1A | ELITE | 95.51 | 95.51 | 0 | |
| 5 | 0 | 5 | Central Washington | D1A | ELITE | 91.68 | 91.68 | 0 | |
| 6 | 0 | 6 | Arkansas State | D1A | ELITE | 86.95 | 86.95 | 0 | |
| 7 | 0 | 7 | Navy | NCR1 | ELITE | Close Win vs Queens | 86.47 | 86.47 | 0 |
| 8 | 0 | 8 | Arizona | D1A | ELITE | 85.5 | 85.5 | 0 | |
| 9 | 0 | 9 | BYU | D1A | ELITE | Big Win vs Utah Valley | 85.06 | 85.06 | 0 |
| 10 | 1 | 11 | Army | NCR1 | ELITE | Big Win vs St. Bonaventure | 81.87 | 83.37 | 1.5 |
| 11 | -1 | 10 | Kutztown | NCR1 | ELITE | Close Loss vs Penn State | 84.79 | 81.14 | -3.65 |
| 12 | 0 | 12 | Grand Canyon | D1A | ELITE | 78.41 | 78.41 | 0 | |
| 13 | 0 | 13 | Davenport | D1A | ELITE | 77.38 | 77.38 | 0 | |
| 14 | 0 | 14 | UCLA | D1A | ELITE | 76.25 | 76.25 | 0 | |
| 15 | 0 | 15 | Penn State | NCR1 | ELITE | Close Win vs Kutztown | 72.37 | 76.02 | 3.65 |
| 16 | 0 | 16 | Iona | NCR1 | ELITE | 70.92 | 70.92 | 0 | |
| 17 | 0 | 17 | Indiana | D1A | ELITE | Big Win vs Illinois | 70.74 | 70.9 | 0.16 |
| 18 | 0 | 18 | Oklahoma | D1A | ELITE | 70.66 | 70.66 | 0 | |
| 19 | 1 | 20 | Northeastern | NCR1 | ELITE | Big Win vs Tufts | 69.66 | 69.66 | 0 |
| 20 | 1 | 21 | Notre Dame College | NCR1 | ELITE | Close Win vs Wheeling | 68.98 | 68.98 | 0 |
| 21 | -2 | 19 | St. Bonaventure | NCR1 | ELITE | Big Loss vs Army | 70.11 | 68.61 | -1.5 |
| 22 | 0 | 22 | Boston College | NCR1 | ELITE | Big Win vs UConn | 62.29 | 62.35 | 0.06 |
| 23 | 0 | 23 | Colorado | D1A | ELITE | Big Win vs Wyoming | 62.07 | 62.07 | 0 |
| 24 | 1 | 25 | Texas A&M | D1A | ELITE | 60.64 | 60.64 | 0 | |
| 25 | 1 | 26 | Utah Valley | D1A | ELITE | Big Loss vs BYU | 59.9 | 59.9 | 0 |
| 26 | UR | Unr | Bowling Green | D1AA | D1 | Big Win vs WMU | 58.23 | 59.63 | 1.4 |
| 27 | 1 | 28 | Ohio State | D1A | ELITE | Big Win vs Michigan | 58.22 | 59.46 | 1.24 |
| 28 | UR | Unr | Adrian College | NCR2 | D2 | Big Win vs CMU | 59.42 | 59.42 | 0 |
| 29 | UR | Unr | Mary Washington | NCR1 | D1 | Big Win vs SVU | 55.1 | 59.4 | 4.3 |
| 30 | -3 | 27 | Illinois | D1A | ELITE | Big Loss vs Indiana | 59.41 | 59.25 | -0.16 |
| 31 | 0 | 31 | Colorado State | D1A | ELITE | Big Win vs Air Force | 55.2 | 58.88 | 3.68 |
| 32 | -3 | 29 | Fairfield | NCR1 | ELITE | Close Win vs Umass | 56.97 | 58.61 | 1.64 |
| 33 | -9 | 24 | American International | NCR1 | ELITE | Big Win vs Albany, Close Loss vs Yale | 61.82 | 55.96 | -5.86 |
| 34 | UR | Unr | Kentucky | D1AA | D1 | Big Win vs Alabama | 55.78 | 55.78 | 0 |
| 35 | -3 | 32 | Baylor | D1A | ELITE | 53.62 | 53.62 | 0 | |
| 36 | -2 | 34 | Wisconsin | D1A | ELITE | 52.61 | 52.61 | 0 | |
| 37 | 2 | 39 | Fordham | NCR1 | ELITE | Close Win vs Colgate | 50.28 | 51.7 | 1.42 |
| 38 | -2 | 36 | North Texas | D1A | ELITE | 51.55 | 51.55 | 0 | |
| 39 | -1 | 38 | Syracuse | NCR1 | ELITE | Big Win vs Cortland | 50.38 | 51.33 | 0.95 |
| 40 | -7 | 33 | Massachusettes | NCR1 | ELITE | Close Loss vs Fairfield | 52.64 | 51 | -1.64 |
| On the Cusp | |||||||||
| Dartmouth | NCR1 | D1 | 65 | 65 | 0 | ||||
| Iowa Central CC | NCR1 | D1 | 65 | 65 | 0 | ||||
| Queens University | NCR1 | D1 | Close Loss vs Navy | 60 | 60 | 0 | |||
| Mount St. Mary's | NCR1 | D1 | Big Win vs Maryland | 58.12 | 58.12 | 0 | |||
| Tennessee | D1AA | D1 | 57.89 | 57.89 | 0 | ||||
| St. Joseph's | NCR1 | D1 | Big Win vs James Madison | 55 | 55 | 0 | |||